Results 1 to 8 of 8

Thread: The real ranking of teams during the bye rounds

  1. #1
    Aut vincere aut mori Thunder Shaker's Avatar
    Join Date
    Apr 2004
    Location
    My secret laboratory in the suburbs of Melbourne
    Posts
    3,844

    The real ranking of teams during the bye rounds

    Byes make it harder to rank teams when some have played more games than others. Here I will post a brief ladder that ranks teams by wins minus losses. This is a better indication of each team's form than the current method that ignores byes completely. This method ignores draws because a draw does not change the wins minus losses for either team.

    The re-ranked ladder after Round 12:
    Code:
                        P  Pts  Perc  W-L
    Collingwood        12  44  138.4  +10
    Port Adelaide      12  40  116.2   +8
    Brisbane Lions     11  32  124.7   +5
    Melbourne          12  32  134.1   +4
    St Kilda           11  28  116.5   +3
    Essendon           12  28  107.8   +2
    Western Bulldogs   12  28  103.7   +2
    Fremantle          11  24  102.3   +1
    Geelong Cats       12  24  118.9    0
    Adelaide Crows     12  24  105.2    0
    Gold Coast Suns    12  24  100.0    0
    Sydney Swans       11  20  101.2   -1
    Richmond           12  18   99.2   -3
    Carlton            12  18   95.1   -3
    GWS Giants         12  16   88.0   -4
    Hawthorn           12  12   75.0   -6
    North Melbourne    12   8   68.5   -8
    West Coast Eagles  12   4   54.1  -10
    Teams that are ranked higher as a result: Brisbane and Fremantle (at the expense of Melbourne and Geelong respectively). Teams that don't move: St Kilda (has the best percentage of teams with seven wins) and Sydney (the only team with five wins).
    "Unbelievable!" -- Nick Davis leaves his mark on the 2005 semi final

  2. #2
    Veterans List
    Join Date
    Aug 2009
    Location
    Crowland :-(
    Posts
    6,109
    Clever work TS. You've obviously got too much time on your bye weekend hands LOL

  3. #3
    Aut vincere aut mori Thunder Shaker's Avatar
    Join Date
    Apr 2004
    Location
    My secret laboratory in the suburbs of Melbourne
    Posts
    3,844
    This week's re-ranked ladder after Round 13:
    Code:
                        P  Pts  Perc  W-L
    Collingwood        13   44  135.1  +9
    Port Adelaide      13   44  117.0  +9
    Melbourne          13   36  132.3  +5
    Brisbane Lions     12   32  119.6  +4
    St Kilda           12   32  116.9  +4
    Essendon           13   32  110.6  +3
    Adelaide Crows     13   28  116.5  +1
    Western Bulldogs   13   28  101.1  +1
    Geelong Cats       12   24  118.9   0
    Fremantle          12   24  100.6   0
    Gold Coast Suns    12   24  100.0   0
    Richmond           13   22  100.7  -2
    Sydney Swans       12   20   99.7  -2
    GWS Giants         13   20   91.1  -3
    Carlton            13   18   92.2  -4
    Hawthorn           13   16   78.5  -5
    North Melbourne    13    8   68.8  -9
    West Coast Eagles  13    4   51.4 -11
    This week's ladder is the same as the normal ladder.

    A few notes showing where percentage has caused teams to be ranked in the same positions in both ladders:
    * Out of teams with eight wins, Essendon has played an extra game and has the worst percentage.
    * Richmond has a better percentage than Sydney and has played an extra game.
    "Unbelievable!" -- Nick Davis leaves his mark on the 2005 semi final

  4. #4
    Aut vincere aut mori Thunder Shaker's Avatar
    Join Date
    Apr 2004
    Location
    My secret laboratory in the suburbs of Melbourne
    Posts
    3,844
    Code:
                        P  Pts  Perc  W-L
    Port Adelaide      14  48  119.3  +10
    Collingwood        13  44  135.1   +9
    Melbourne          13  36  132.3   +5
    Brisbane Lions     13  36  119.6   +5
    St Kilda           13  32  113.1   +3
    Essendon           13  32  110.6   +3
    Western Bulldogs   14  32  102.9   +2
    Adelaide Crows     13  28  116.5   +1
    
    Geelong Cats       13  24  113.6   -1
    Richmond           14  26  102.4   -1
    Gold Coast Suns    13  24   94.7   -1
    Fremantle          13  24   94.3   -1
    GWS Giants         14  24   97.0   -2
    Sydney Swans       13  20   98.3   -3
    Carlton            14  22   98.1   -3
    Hawthorn           13  16   78.5   -5
    North Melbourne    14   8   69.6  -10
    West Coast Eagles  13   4   51.4  -11
    The final instalment of the real ladder for this year has the GWS Giants slipping down two places, due to the extra game that they have played.
    The draw between Carlton and Richmond is the extra game that elevates these teams. If wins minus losses is considered, both teams move down one place.
    "Unbelievable!" -- Nick Davis leaves his mark on the 2005 semi final

  5. #5
    What's the percentage of teams coming off the bye losing ?. Seems very high this year.

  6. #6
    Aut vincere aut mori Thunder Shaker's Avatar
    Join Date
    Apr 2004
    Location
    My secret laboratory in the suburbs of Melbourne
    Posts
    3,844
    Quote Originally Posted by barry View Post
    What's the percentage of teams coming off the bye losing ?. Seems very high this year.
    The bye is certainly cursed this year. I read somewhere that teams coming off the bye had only one win this year, and that was because two teams coming off the bye played each other (Sydney and St Kilda).

    Round 12 byes: Brisbane, Fremantle, St Kilda, Sydney. Round 13 results: loss, loss, win, loss. (St Kilda played Sydney).
    Round 13 byes: Geelong, Gold Coast. Round 14 results: loss, loss.
    Round 14 byes: Adelaide, Collingwood, Essendon, Hawthorn, Melbourne, West Coast. Round 15 results: ?, ?, ?, ?, loss, ?.
    Round 15 byes: Carlton, GWS Giants, North Melbourne, Port Adelaide, Richmond. Round 16 results: ?, ?, ?, ?, ?, ?.
    "Unbelievable!" -- Nick Davis leaves his mark on the 2005 semi final

  7. #7
    Aut vincere aut mori Thunder Shaker's Avatar
    Join Date
    Apr 2004
    Location
    My secret laboratory in the suburbs of Melbourne
    Posts
    3,844
    The numbers that don’t bode well for the weekend’s bye teams (sen.com.au)
    Teams coming off the bye have had 2 wins, 10 losses. Teams coming off the bye played each other in 2 matches. Teams coming off the bye playing a non-bye team have not won a single game this year.

    - - - Updated - - -

    The article also suggests doing away with the staggered byes and having a bye for all clubs in the same week. I agree with this suggestion.
    "Unbelievable!" -- Nick Davis leaves his mark on the 2005 semi final

  8. #8
    Senior Player
    Join Date
    Aug 2009
    Location
    Sydney
    Posts
    1,746

    I've enjoyed the weekly updates in this thread.

    The so-called "curse of the bye" is something of a bugbear for me, so I took a closer look at the numbers. If you like lots of charts, here it is.
    Brief summary: once scheduling and the predicted result are taken into account, only a small number of post-bye game results each season are unexpected.

    The issue I have with these annual articles in the AFL media concerning the effect of the bye is that they are usually very simplistic, just win-loss counts with no further consideration of why teams might be losing after a bye.
    One particularly bad example doesn't even take into account whether one or both teams came off the bye! Clearly, if coming off a bye is theoretically a disadvantage, that would be cancelled out when both teams come off it.

    I think the most important factor missing from these articles is: was the team that lost expected to lose?
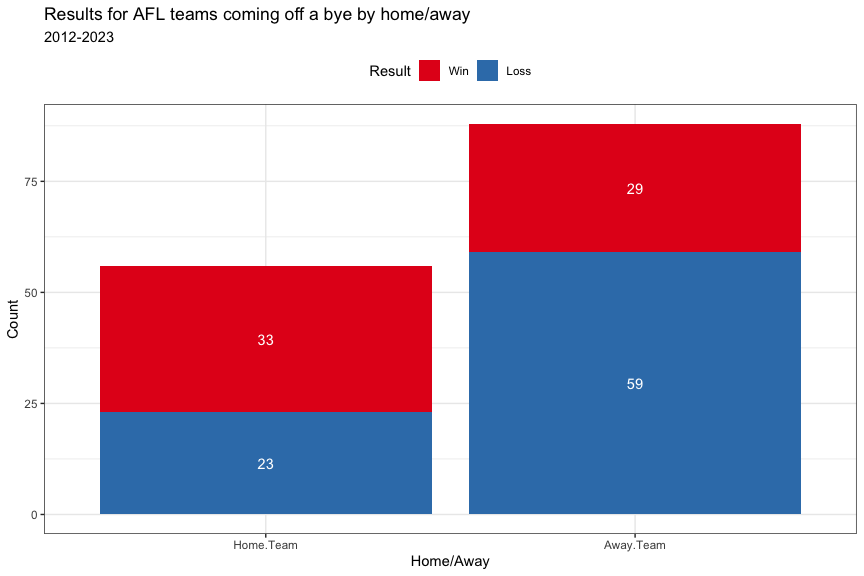
    By a quirk of scheduling, it turns out that of the 144 post-mid-season bye games 2012-2023 with one team coming off a bye, that team was the away team in 88 games (61%). And we know that away teams are more likely to lose.

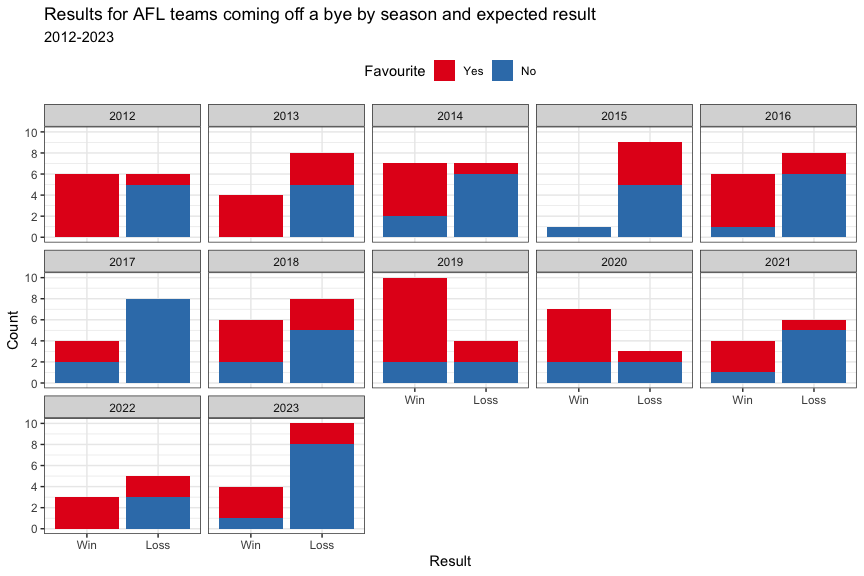
    We can go further by looking at the betting odds for those games to see who was the favourite. And we see that whilst there is some variation, favourites generally win and non-favourites generally lose.

    By team? Gold Coast's post-mid-season bye record is 1-9 (win-loss). But guess what - they were favourites in the game that they won and non-favourites in the nine that they lost. In other words they lose a lot of games in general, leading to low expectations.

    That's an extreme case and at the other extreme is Geelong, who do seem to have a genuine post-bye issue in that they have lost a large proportion of post-bye games that they were expected to win.

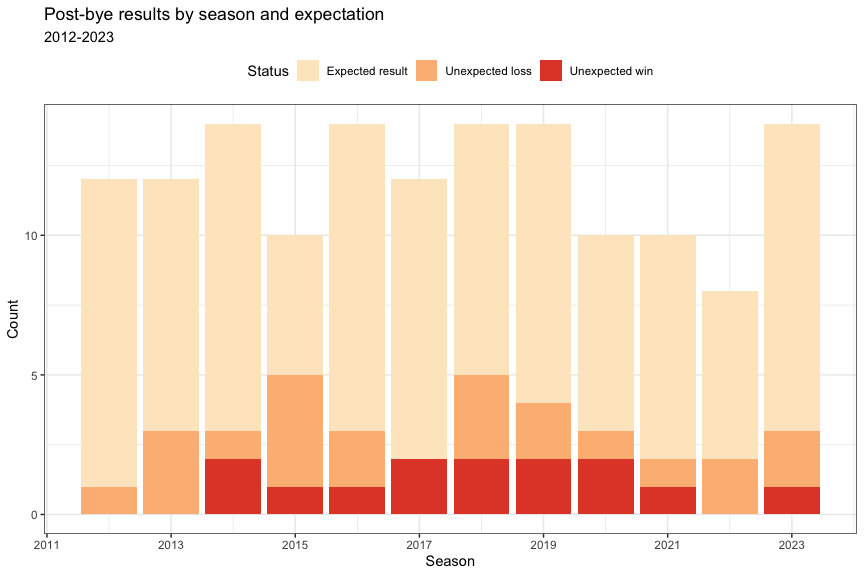
    When we take who was expected to win into account, there are typically 2-3 unexpected results in games with one team coming off the bye each season.

    For the 14 such games in 2023 there was one unexpected win (GWS vs Melbourne) and two unexpected losses (Brisbane vs Hawthorn and Fremantle vs Richmond).

    Here's the full set of 14 post-bye games (one team off the bye) for 2023.

    Season Round Team HA.Name Opponent Margin Result Odds Favourite
    2023 R13 Brisbane Lions Away.Team Hawthorn -25 L 1.25 Y
    2023 R13 Fremantle Home.Team Richmond -15 L 1.63 Y
    2023 R14 Geelong Away.Team Port Adelaide -38 L 2.34 N
    2023 R14 Gold Coast Away.Team Carlton -59 L 2.21 N
    2023 R15 Melbourne Away.Team Geelong -15 L 1.99 N
    2023 R15 West Coast Away.Team Sydney -171 L 12.23 N
    2023 R15 Essendon Away.Team Fremantle -32 L 2.16 N
    2023 R15 Hawthorn Away.Team Gold Coast -67 L 3.61 N
    2023 R16 Richmond Away.Team Brisbane Lions -81 L 3.21 N
    2023 R16 North Melbourne Away.Team Adelaide -66 L 8.22 N
    2023 R16 Western Bulldogs Home.Team Fremantle 29 W 1.52 Y
    2023 R16 Port Adelaide Away.Team Essendon 4 W 1.44 Y
    2023 R16 Carlton Away.Team Hawthorn 60 W 1.34 Y
    2023 R16 GWS Away.Team Melbourne 2 W 2.88 N

Tags for this Thread

Posting Permissions

  • You may not post new threads
  • You may not post replies
  • You may not post attachments
  • You may not edit your posts
  •  
Single Sign On provided by vBSSO